# Memory Analysis
When troubleshooting memory leaks, you can assist the analysis by taking two memory snapshots (dumps). For example, to troubleshoot a page memory leak, take a dump before entering the page and another after exiting the page. There are two scenarios for troubleshooting memory leaks:
For applications that do not rely on low-level capabilities: If your application does not require low-level capabilities, you can test directly in AIoT-IDE. Click on Position 4 before and after the problematic scenario to take memory snapshots.
For applications that rely on low-level capabilities: You need to install firmware capable of executing JavaScript heap memory snapshots, run the command dump_js_heap /sdcard, and then copy the snapshot file from the real device to your computer. Load and analyze it in AIoT-IDE via Position 3.
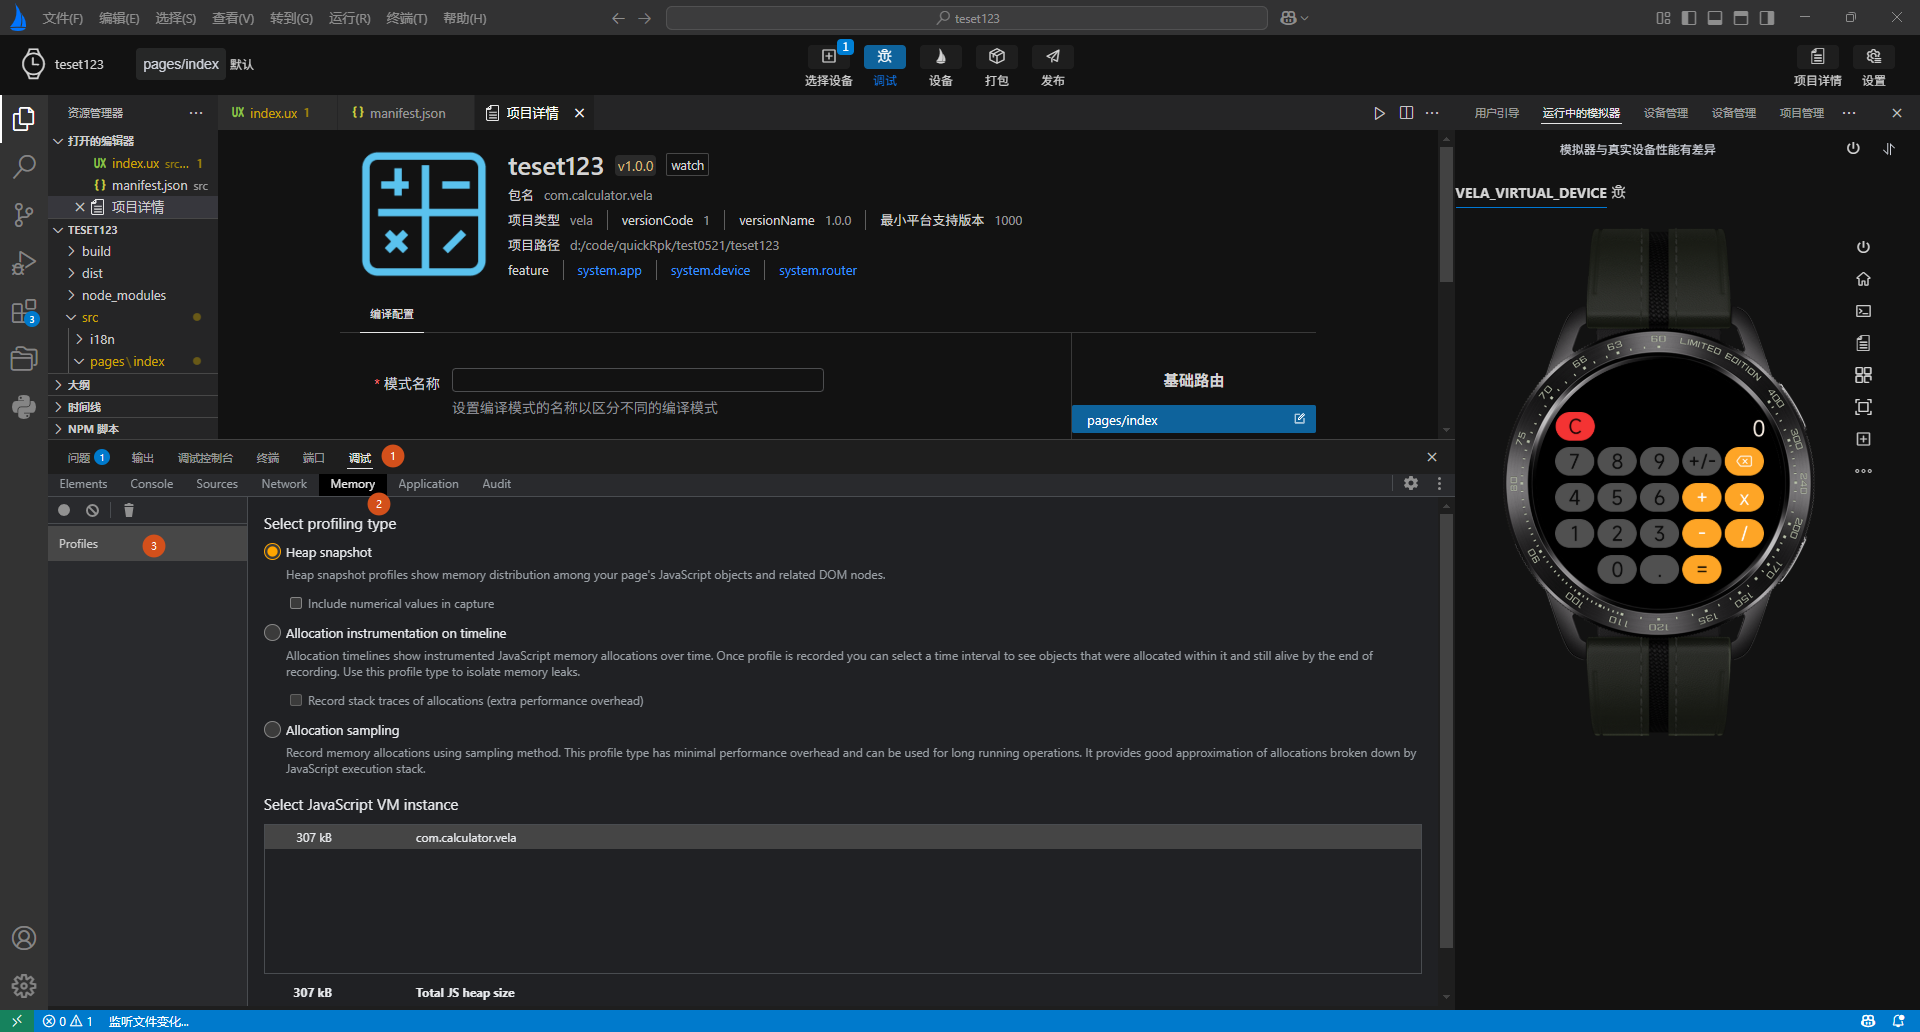
In AIoT-IDE, the tools for JavaScript heap analysis and export are located in the function panel area. Select Debug -> Snapshot -> Profile, as shown in labels 1, 2, and 3 in the following image: