# Understanding the Interface
# Interface Layout
The main window of AIoT-IDE consists of several primary areas, as follows:
- Sidebar: Provides functions such as resource explorer, search, Git management, plugin marketplace, and quick access.
- Menu Bar: Includes menu items like File, Edit, Selection, View, Go To, Terminal, Window, Help, etc.
- Toolbar: Contains functional button options such as selecting a device, starting debugging, and packaging.
- Code Editing Area: Includes functions like code editing, definition jumping, code completion, and error prompting. For details, refer to Code Completion.
- Function Panel: Provides panels for issues, output, terminal, debugging, etc.
- Simulator: Includes functions such as onboarding page prompts, simulation preview, simulating real device operations, and taking screenshots.
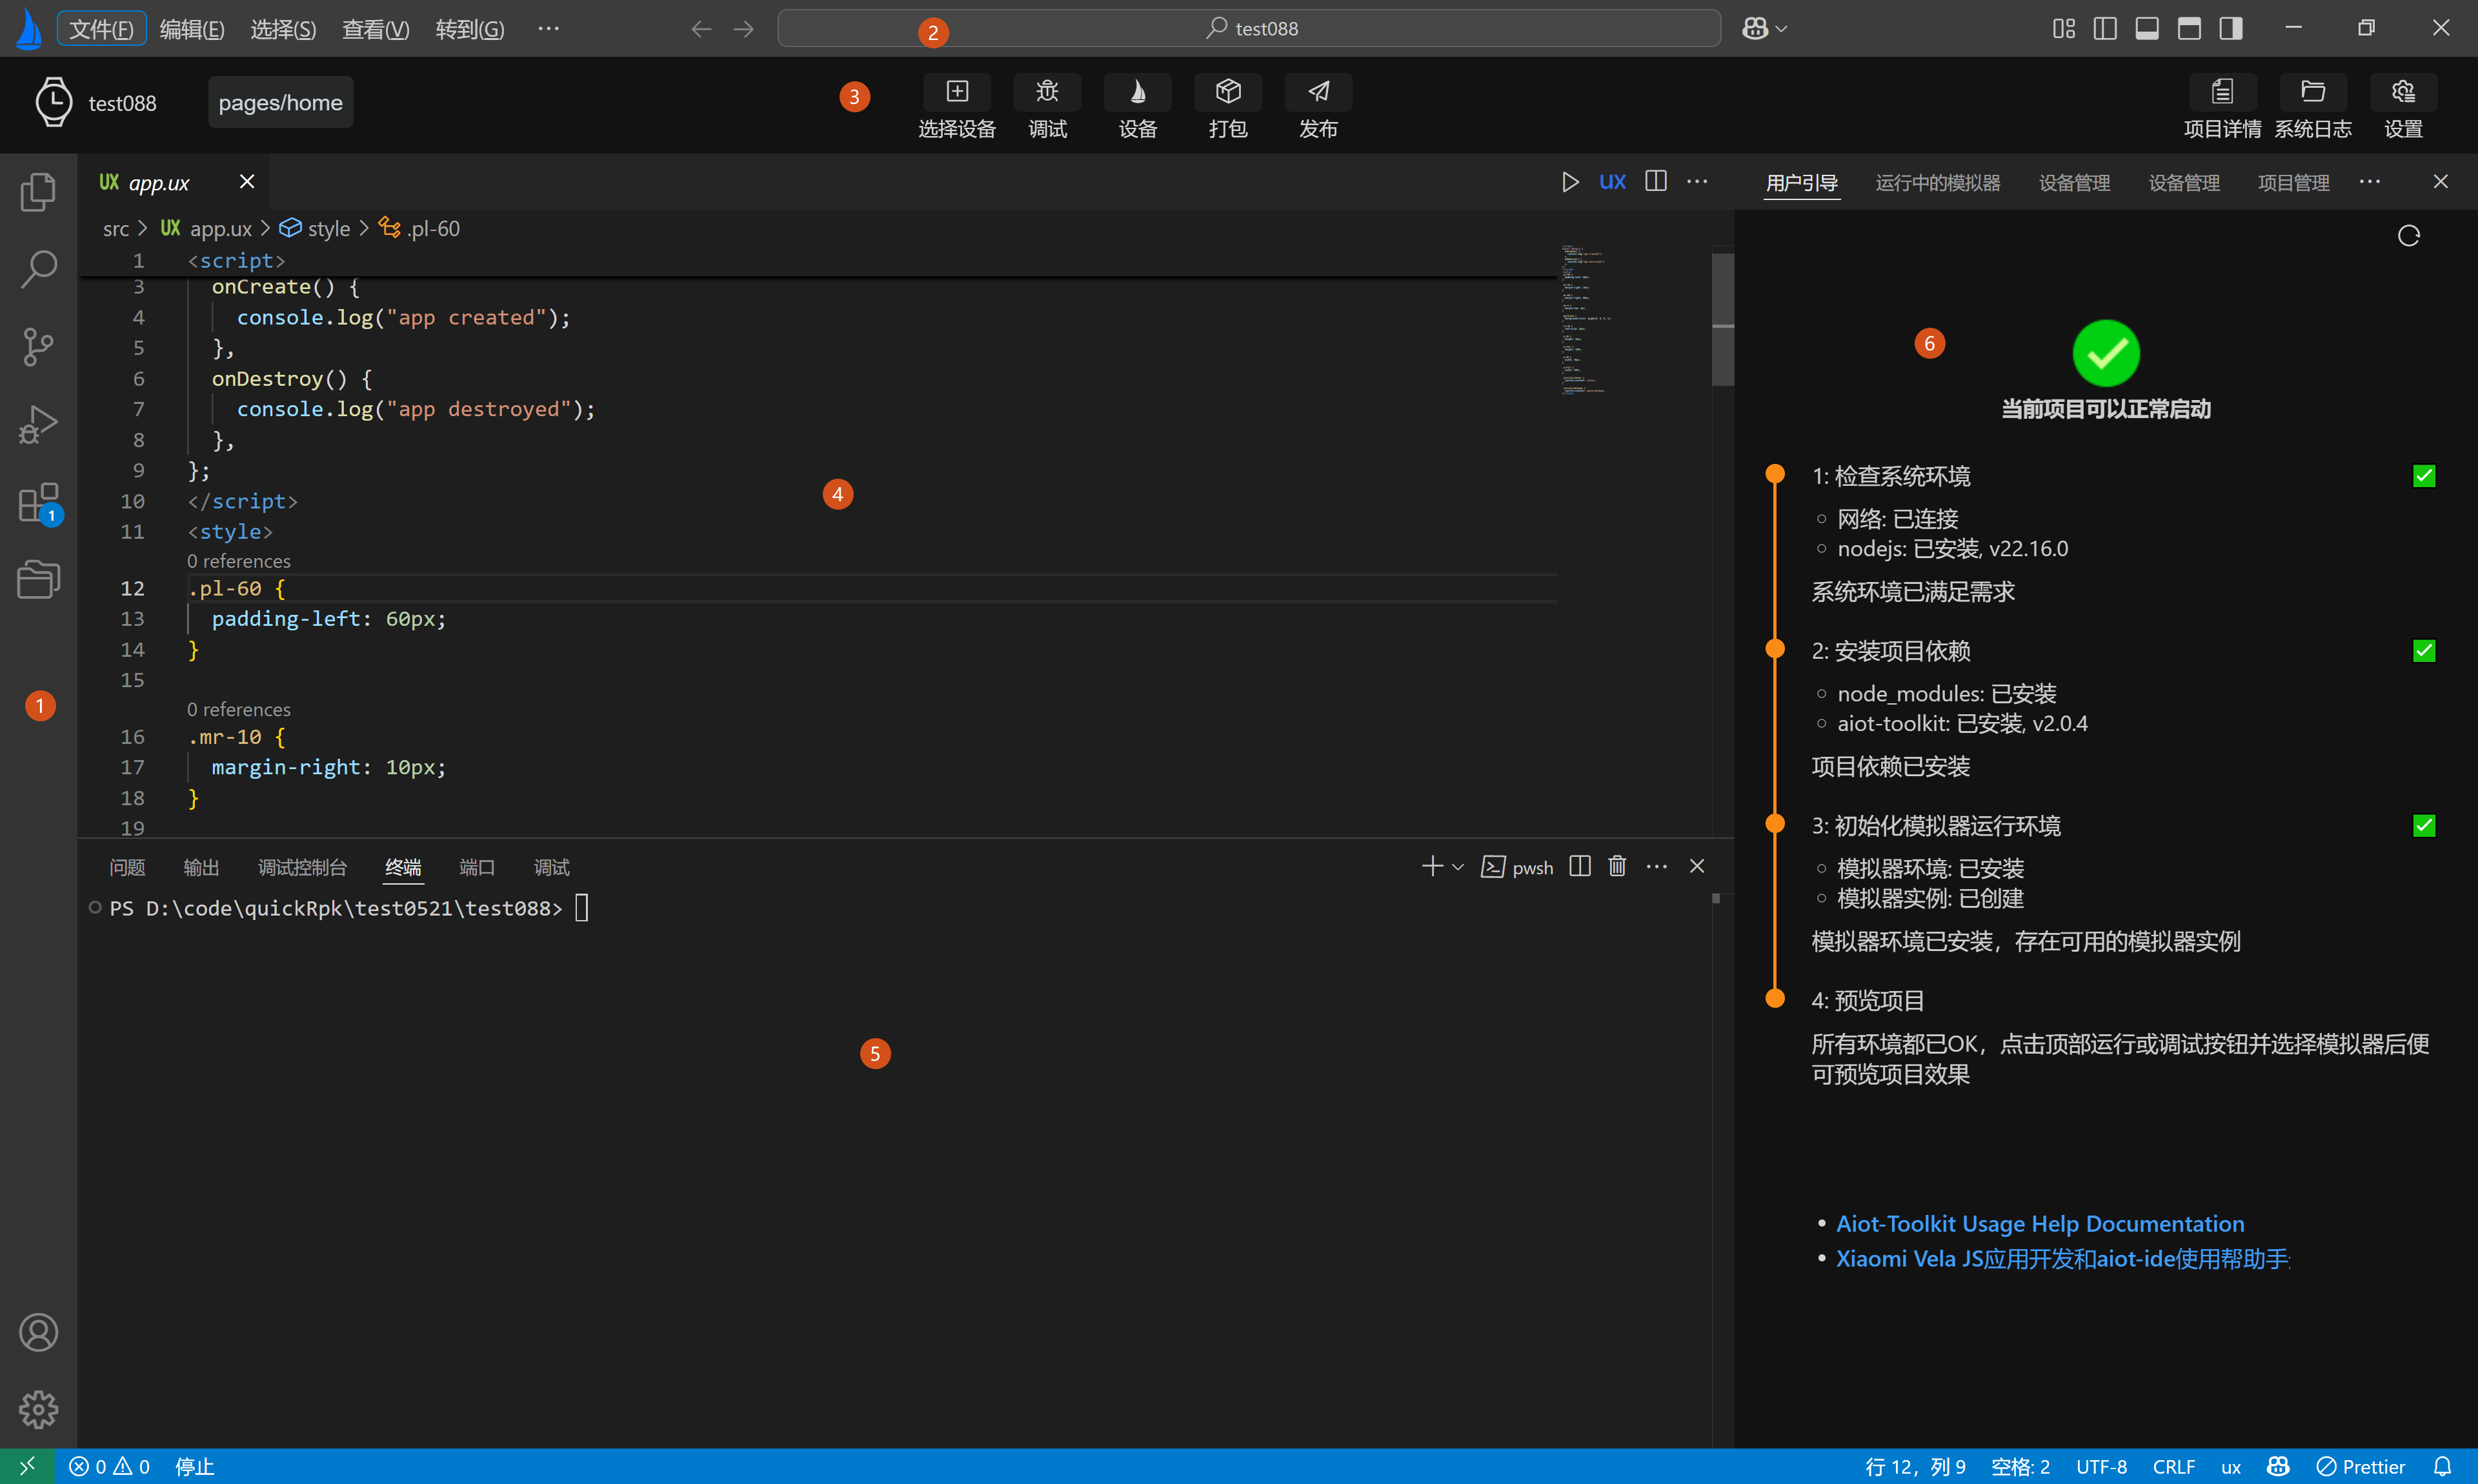
The main window interface will only appear as shown in the image above if a Xiaomi Vela JS application is opened through AIoT-IDE. AIoT-IDE automatically identifies whether the opened project is a Xiaomi Vela JS application project based on the project structure.
# Toolbar Interface
The toolbar interface of AIoT-IDE contains several commonly used functions:
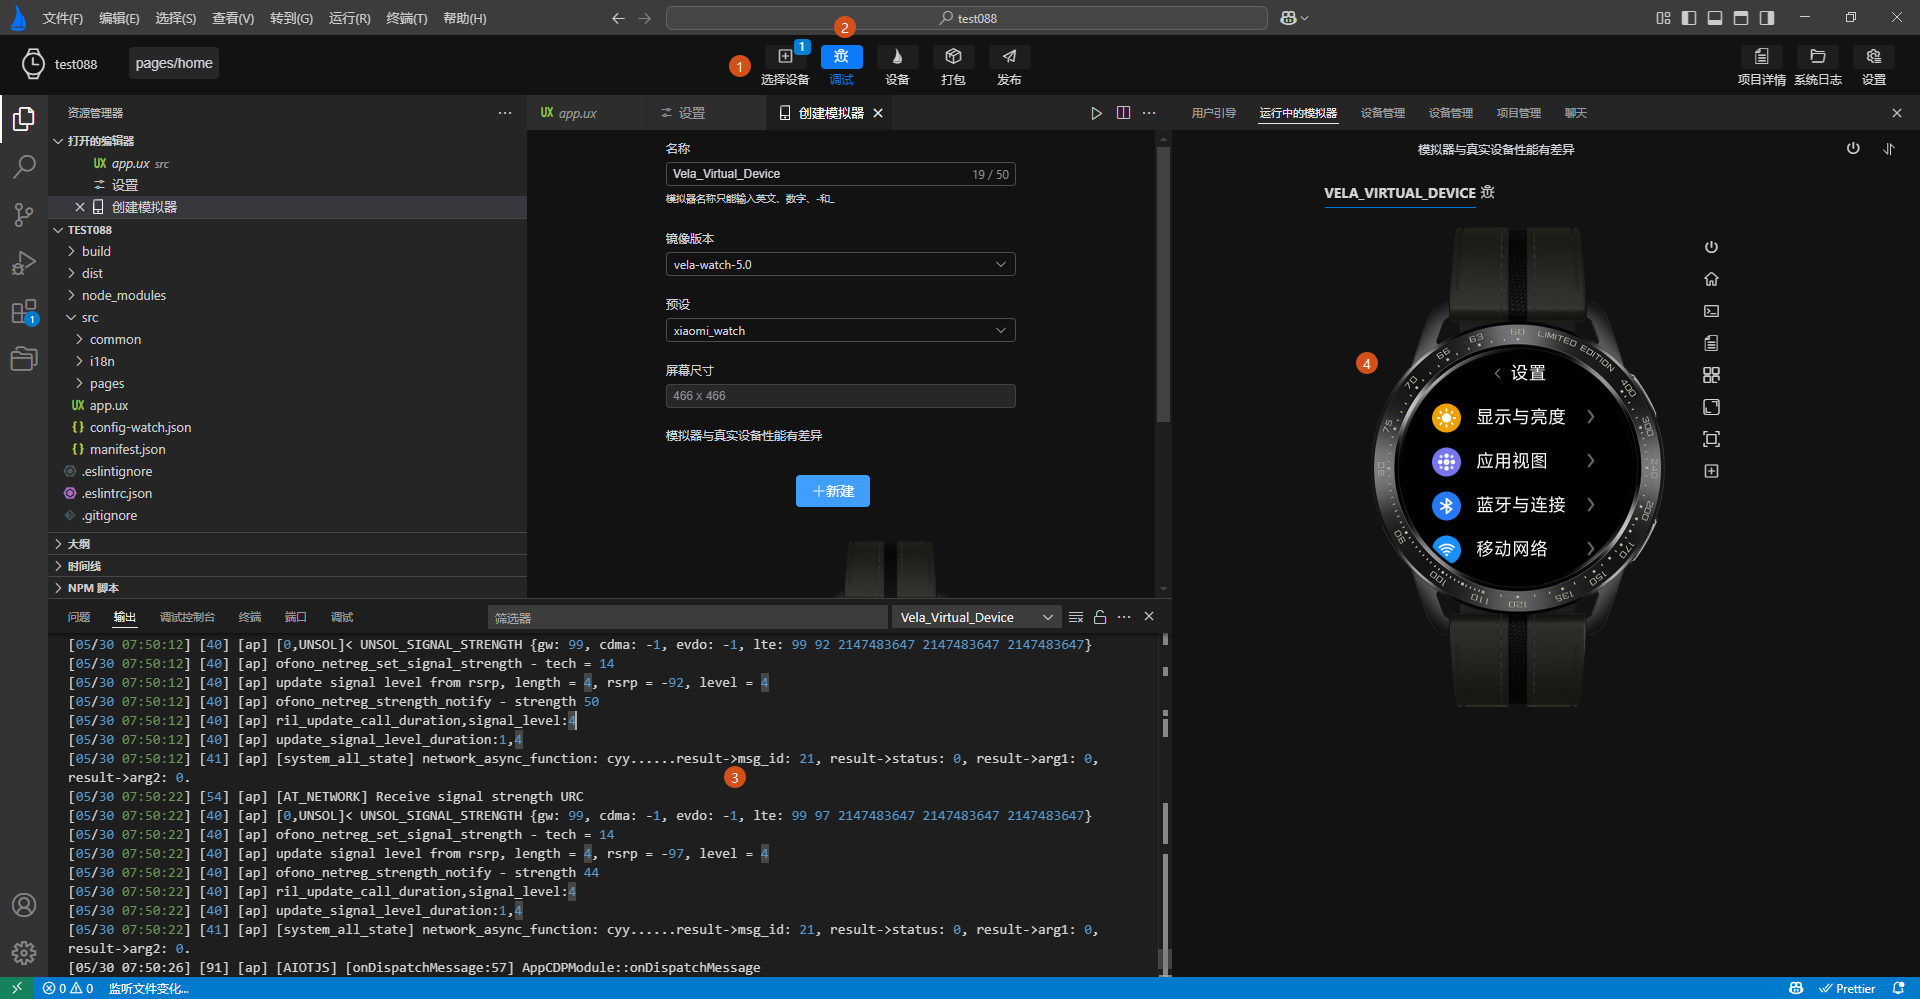
- Select Device: Choose a locally created simulator for subsequent debugging.
- Debug: Compile and preview the currently opened Xiaomi Vela JS application project using the selected simulator, and open the debugging panel.
- Device: Open the device management page to create simulators with different image types and device types.
- Package: Package the current Xiaomi Vela JS application project into an rpk.
- Publish: Generate a release-type application package (RPK).
Additionally, AIoT-IDE supports direct previewing of the rpk packaged from a Xiaomi Vela JS application project. The directory obtained by unzipping the rpk can be opened through AIoT-IDE to preview the rpk.
# Simulator Interface
The simulator interface mainly consists of four parts:
- User Onboarding Page
- Simulator SDK Management Page
- Device Management Page
- Simulator Run Preview Page
# User Onboarding Page
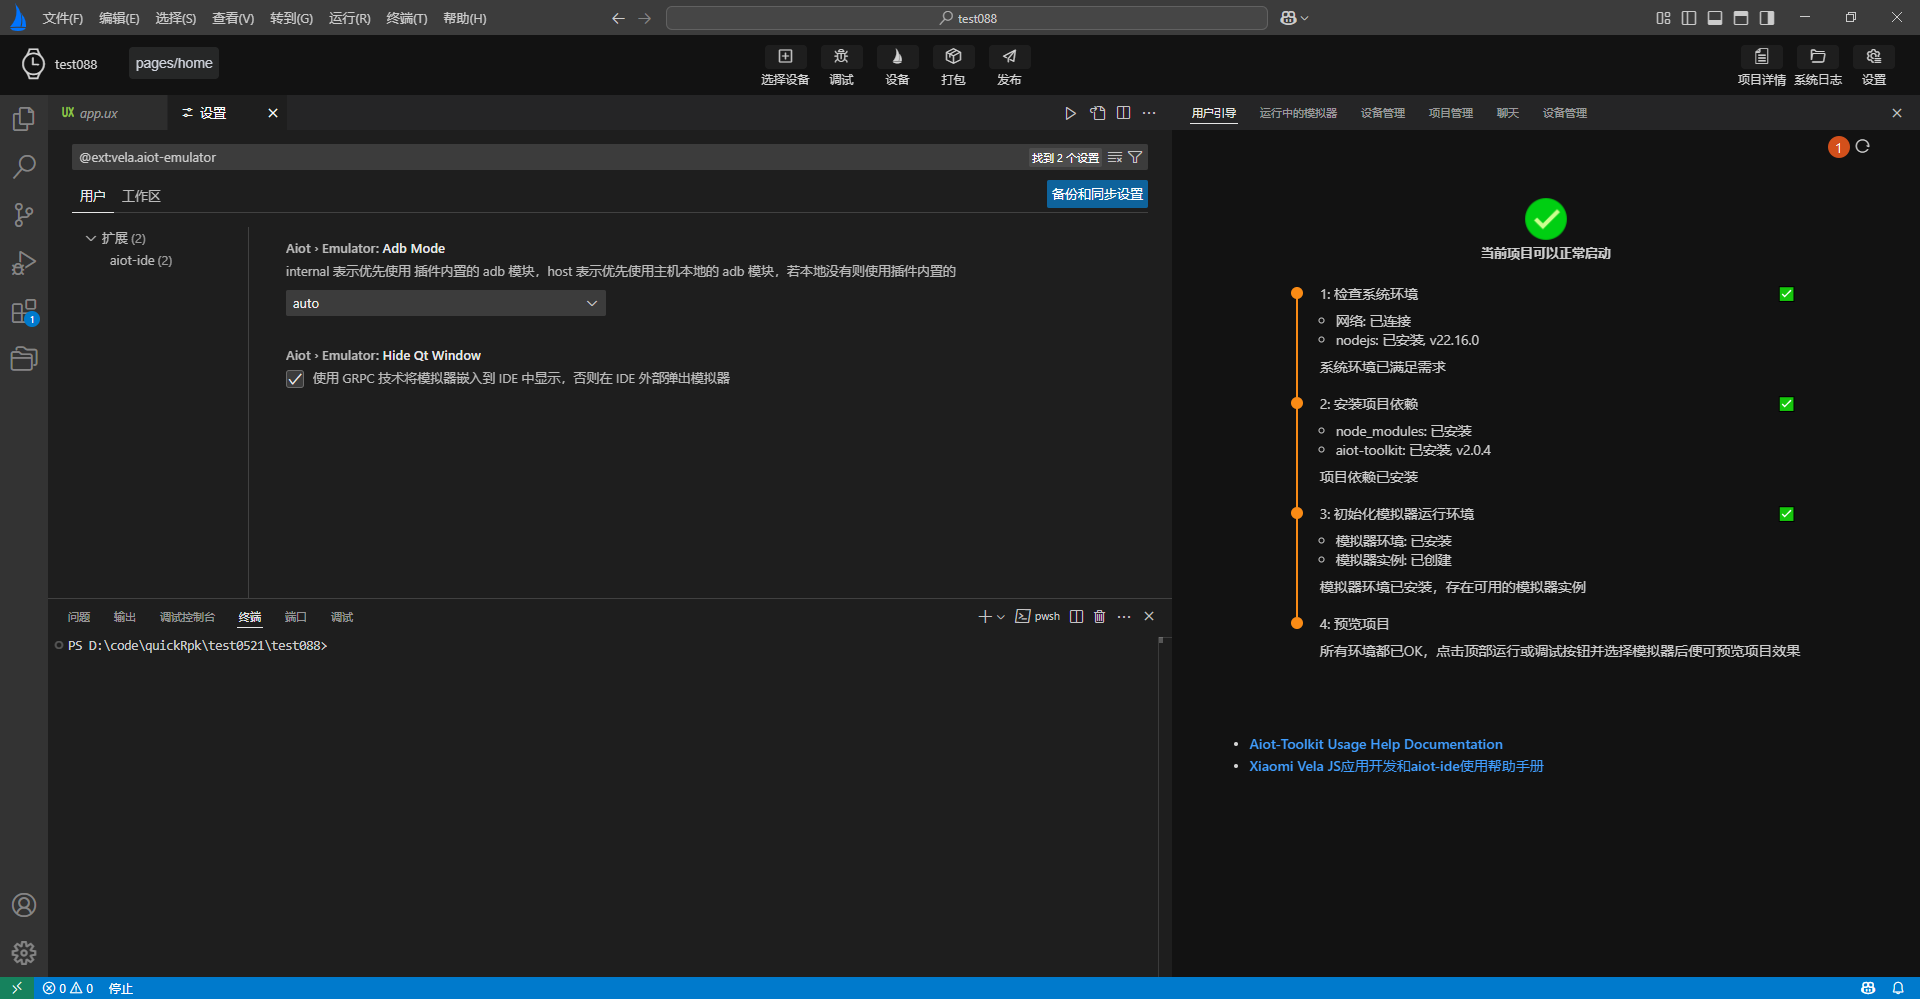
The simulator User Onboarding Page guides users to initialize the runtime environment for the Xiaomi Vela JS application simulator. Follow the prompts on the onboarding page:
- Install project dependencies and wait for the project dependencies and environment installation to complete before you can normally compile and preview the Xiaomi Vela JS application project.
- Initialize the simulator environment. The simulator user onboarding page will automatically check if the current environment has the simulator runtime environment. If not, follow the prompts on the user onboarding page to automatically install the simulator environment.
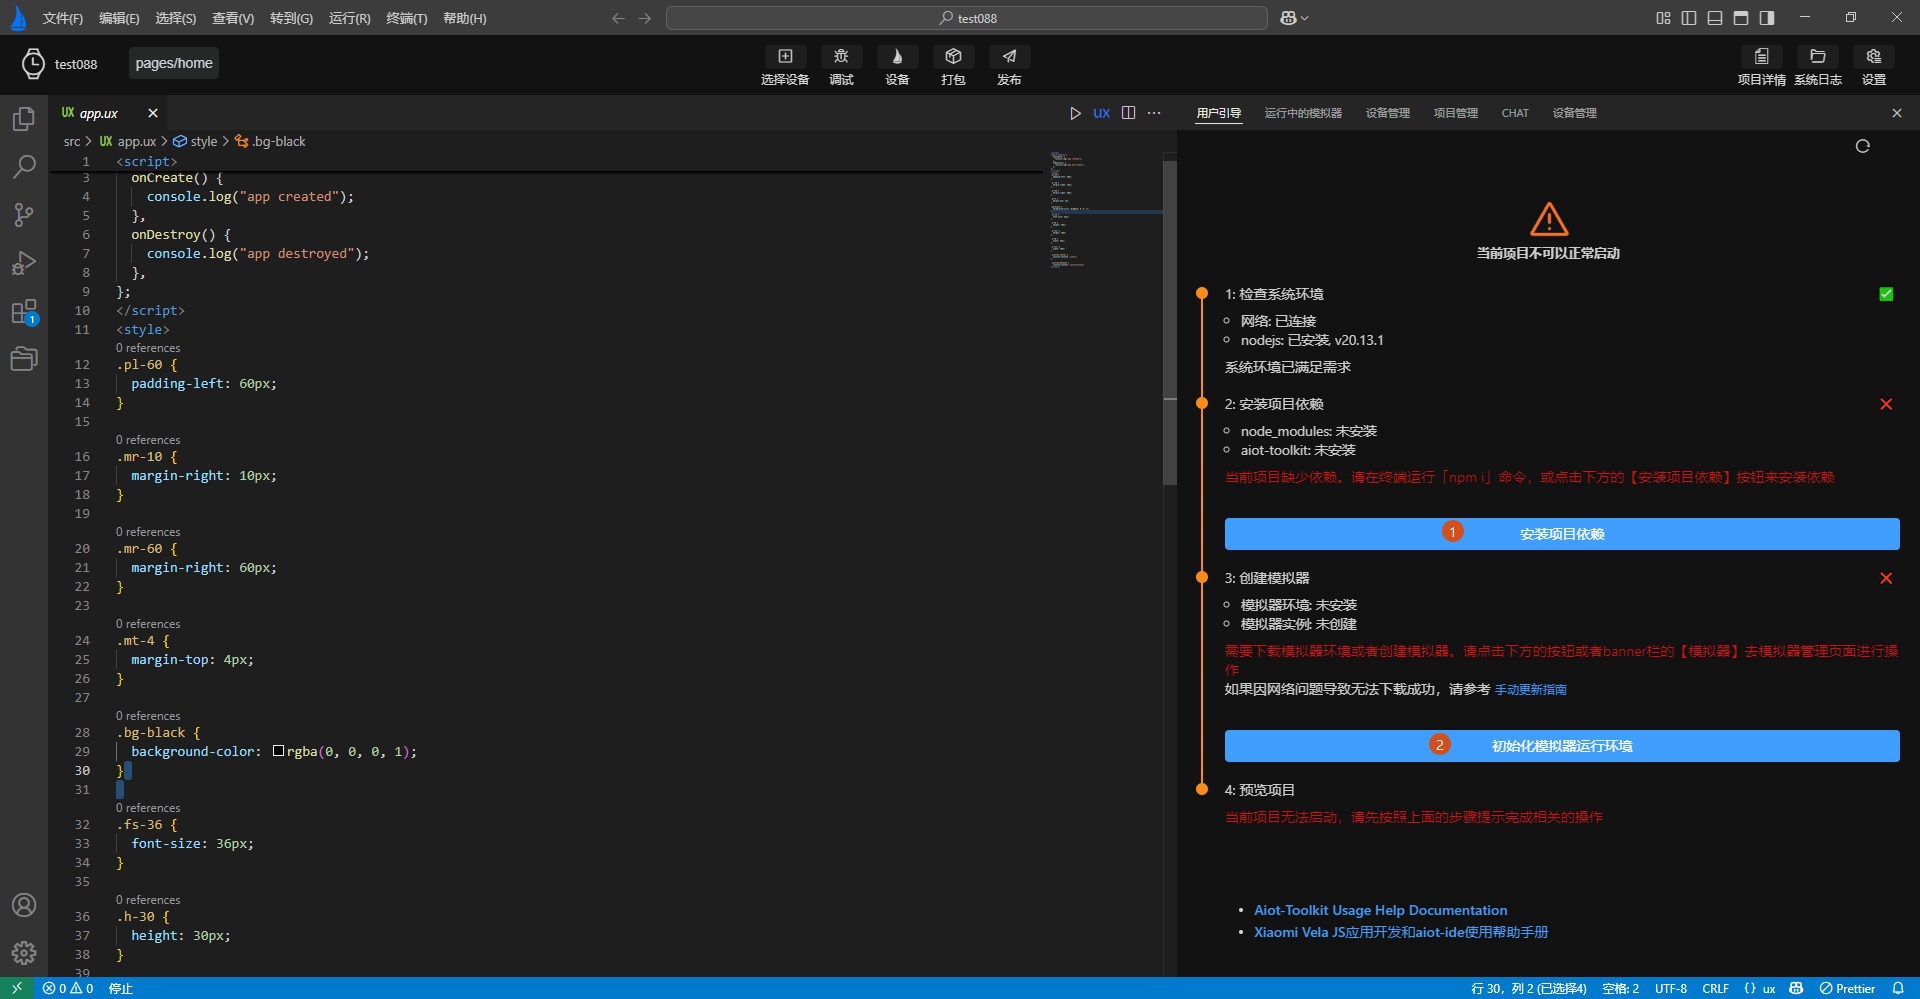
After correctly following the prompts on the onboarding page as shown in the image above, the onboarding page will provide a prompt indicating that the current project can be normally started, as shown by Label 1 in the image below.
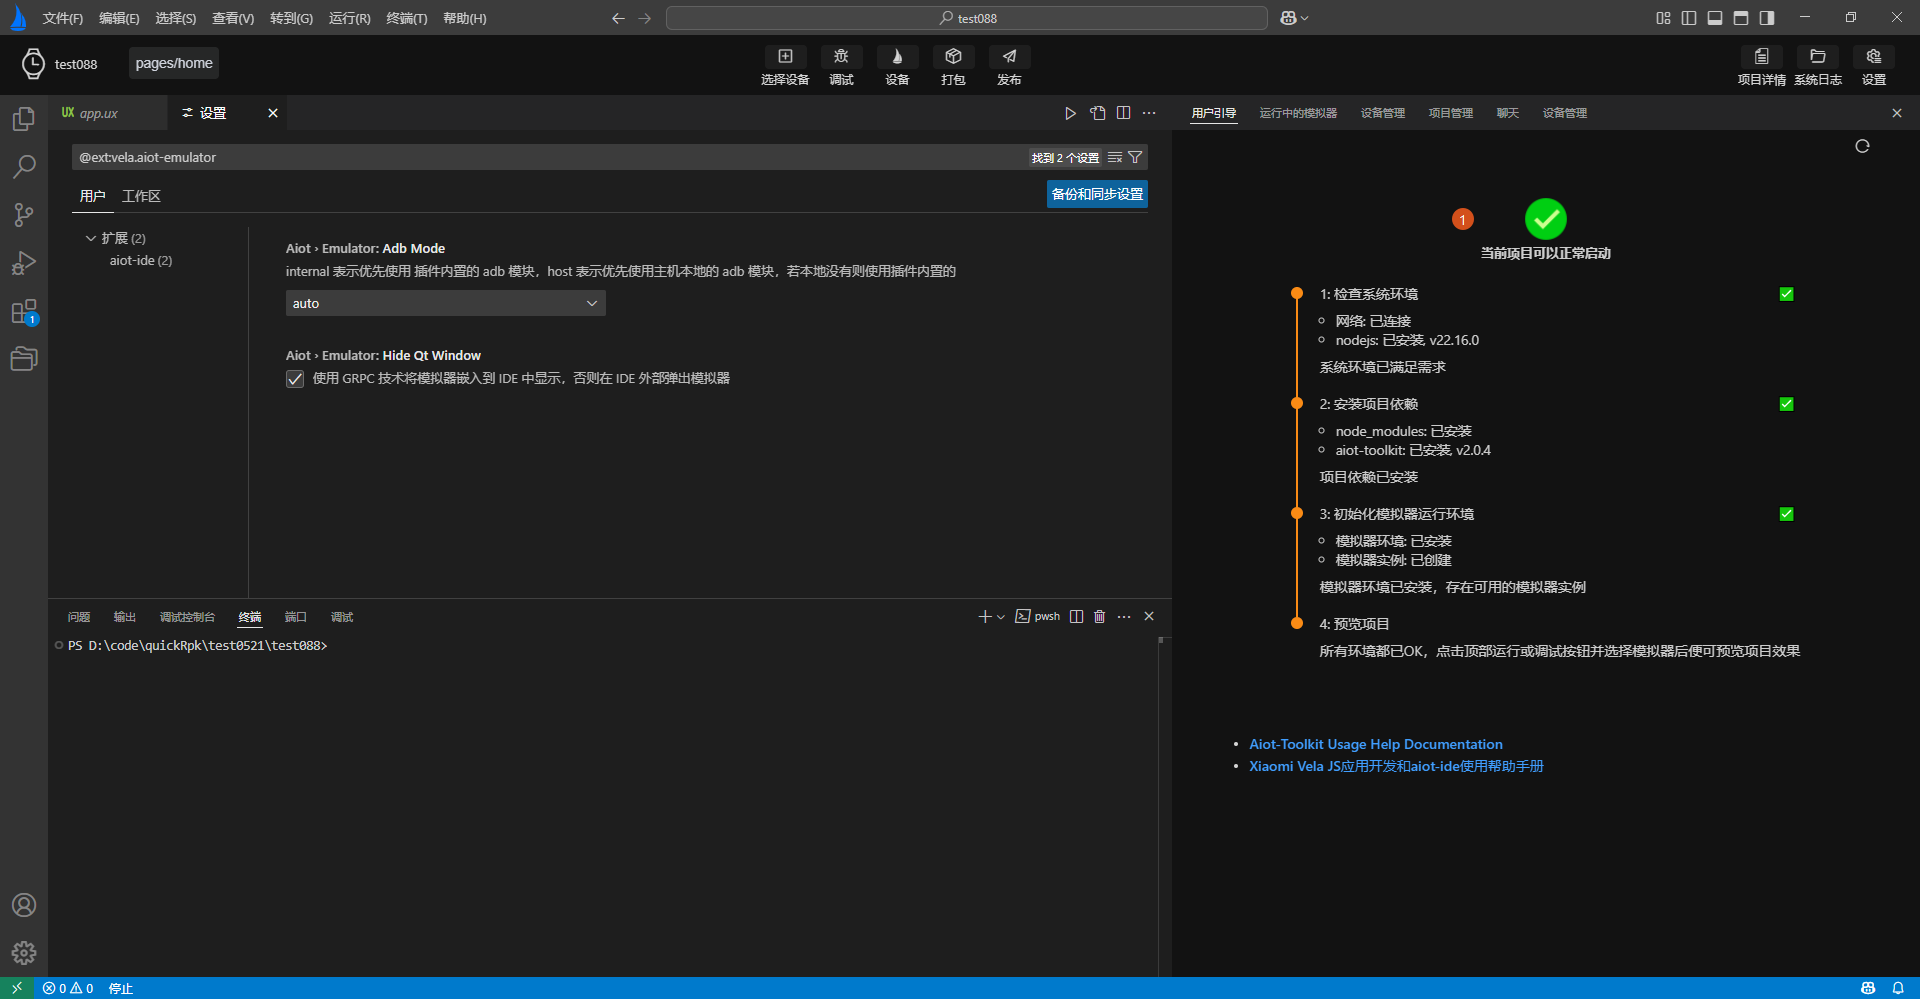
Note: For performance considerations, the onboarding page will not continuously poll to check if the project dependencies and simulator runtime environment are ready. When users choose to manually install the project dependencies and simulator runtime environment, they can click the refresh button in the top-right corner of the onboarding page to refresh the onboarding page status.
# Device Management Page
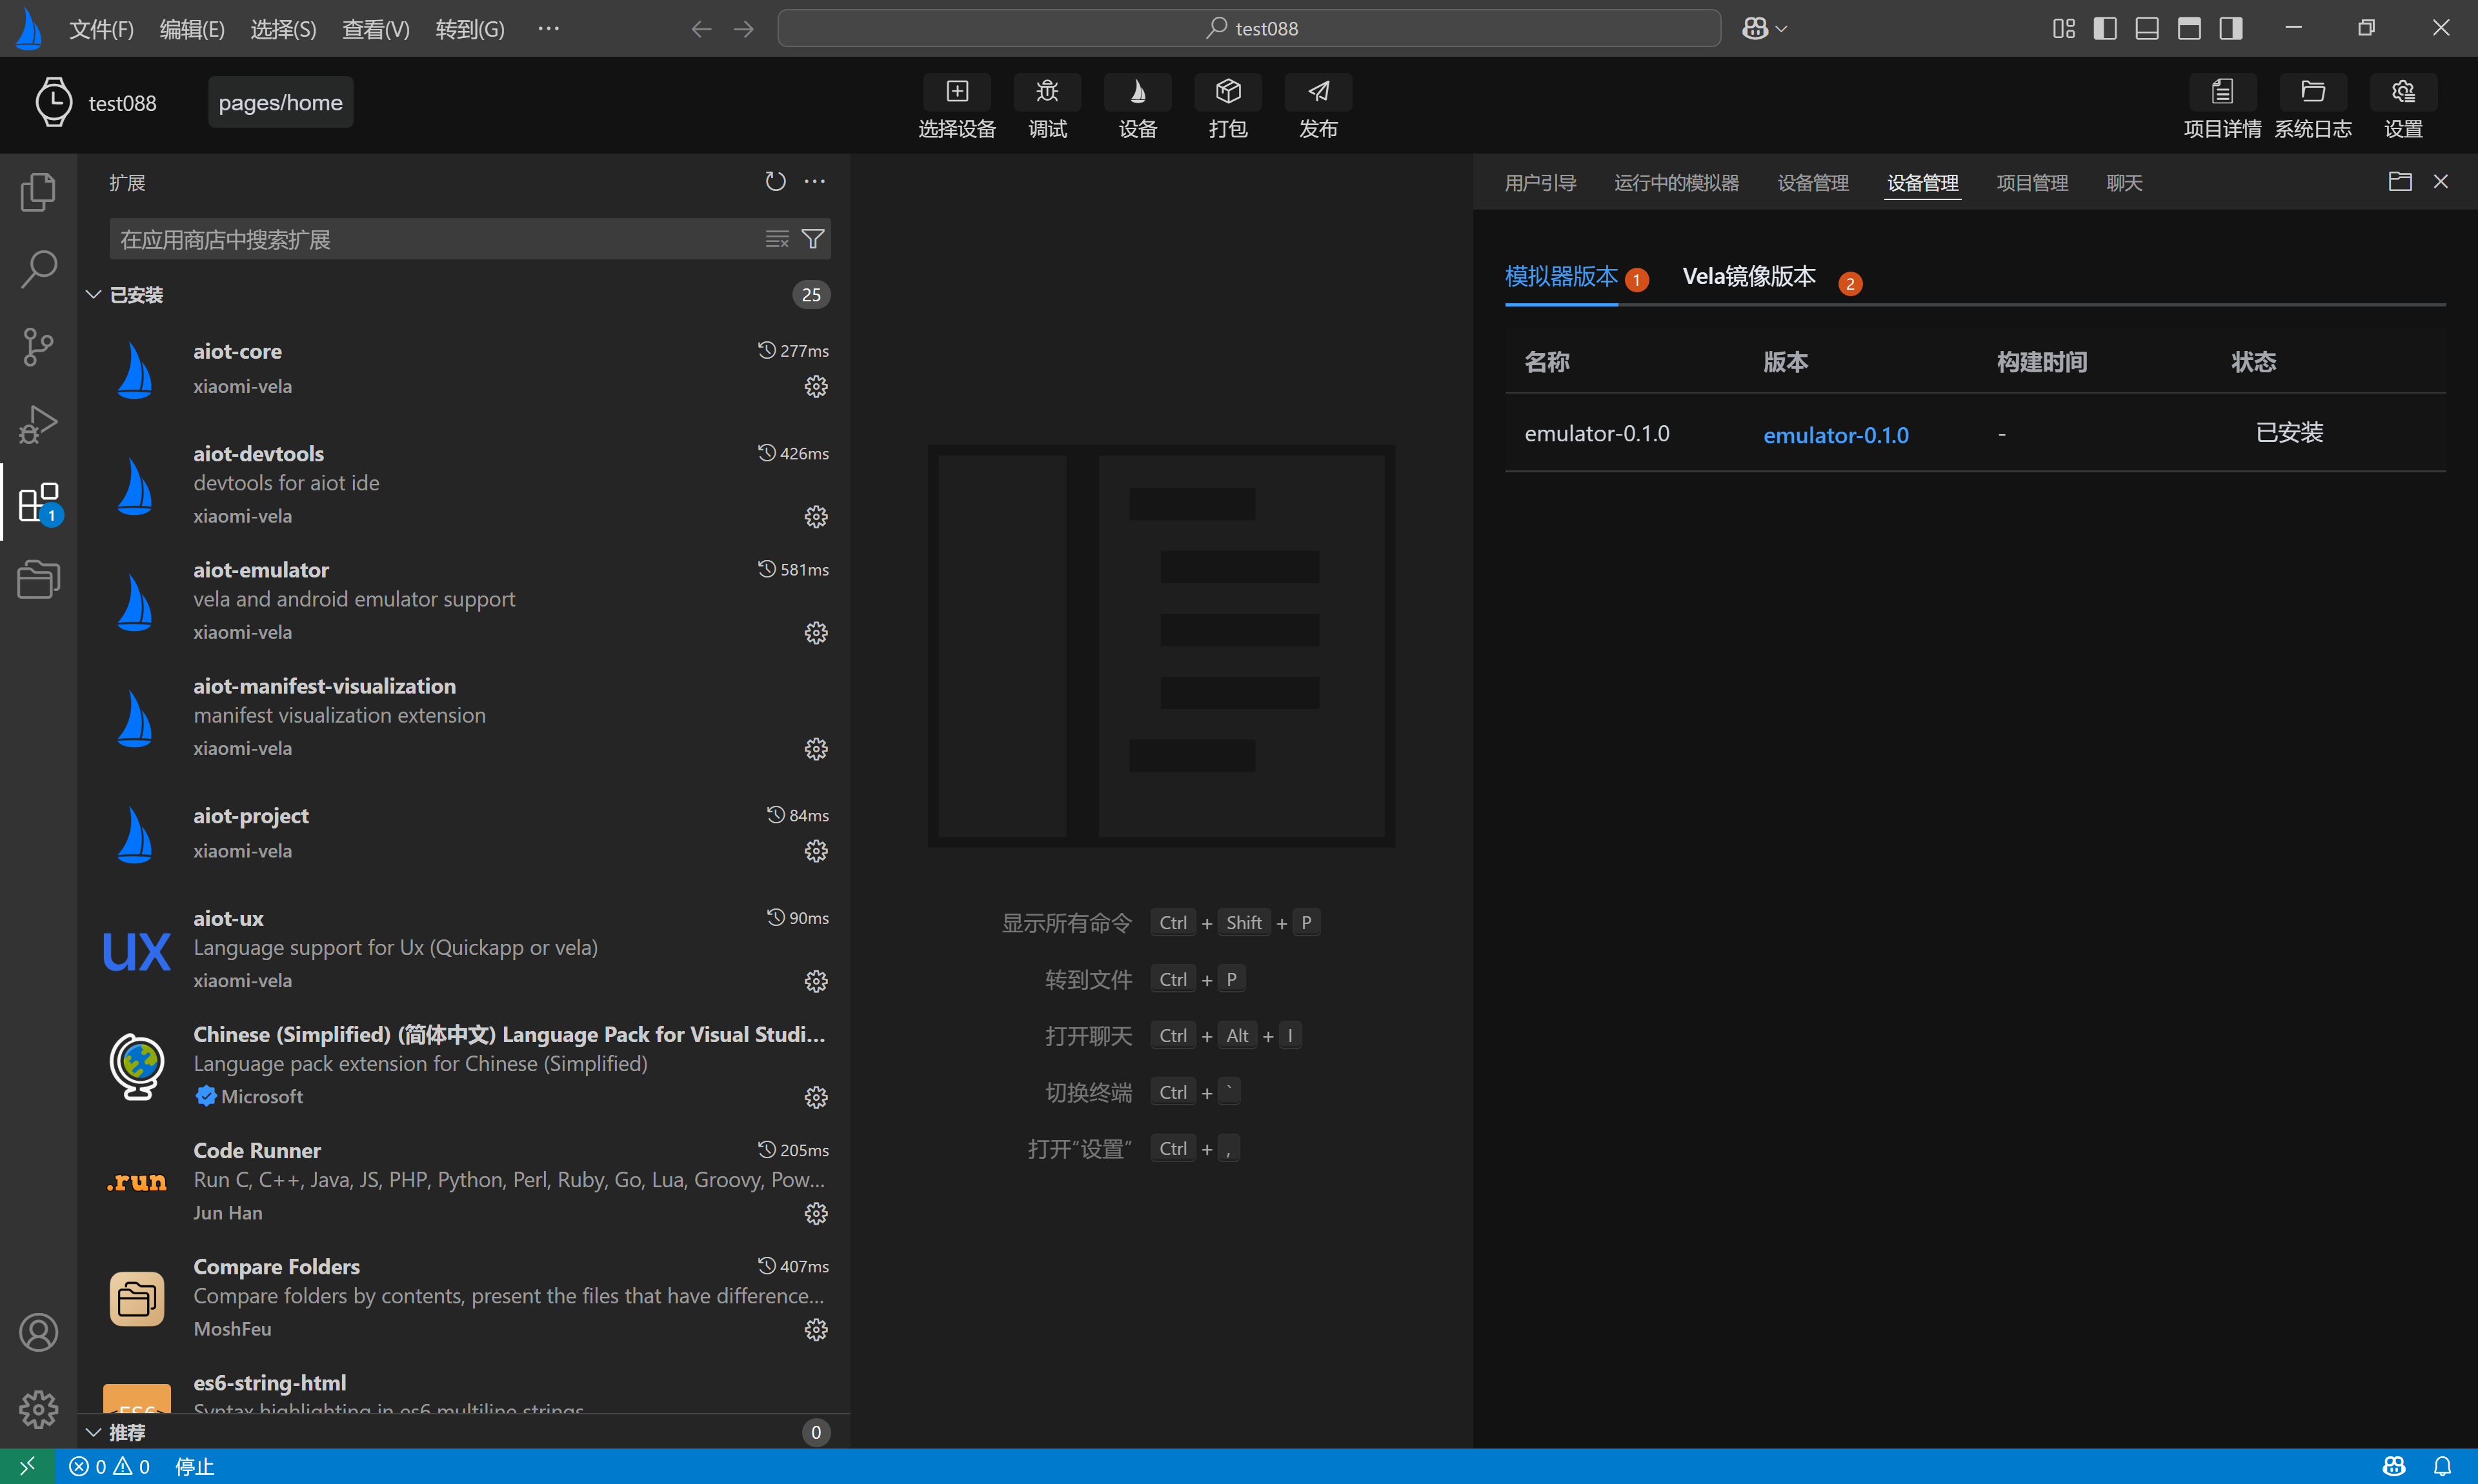
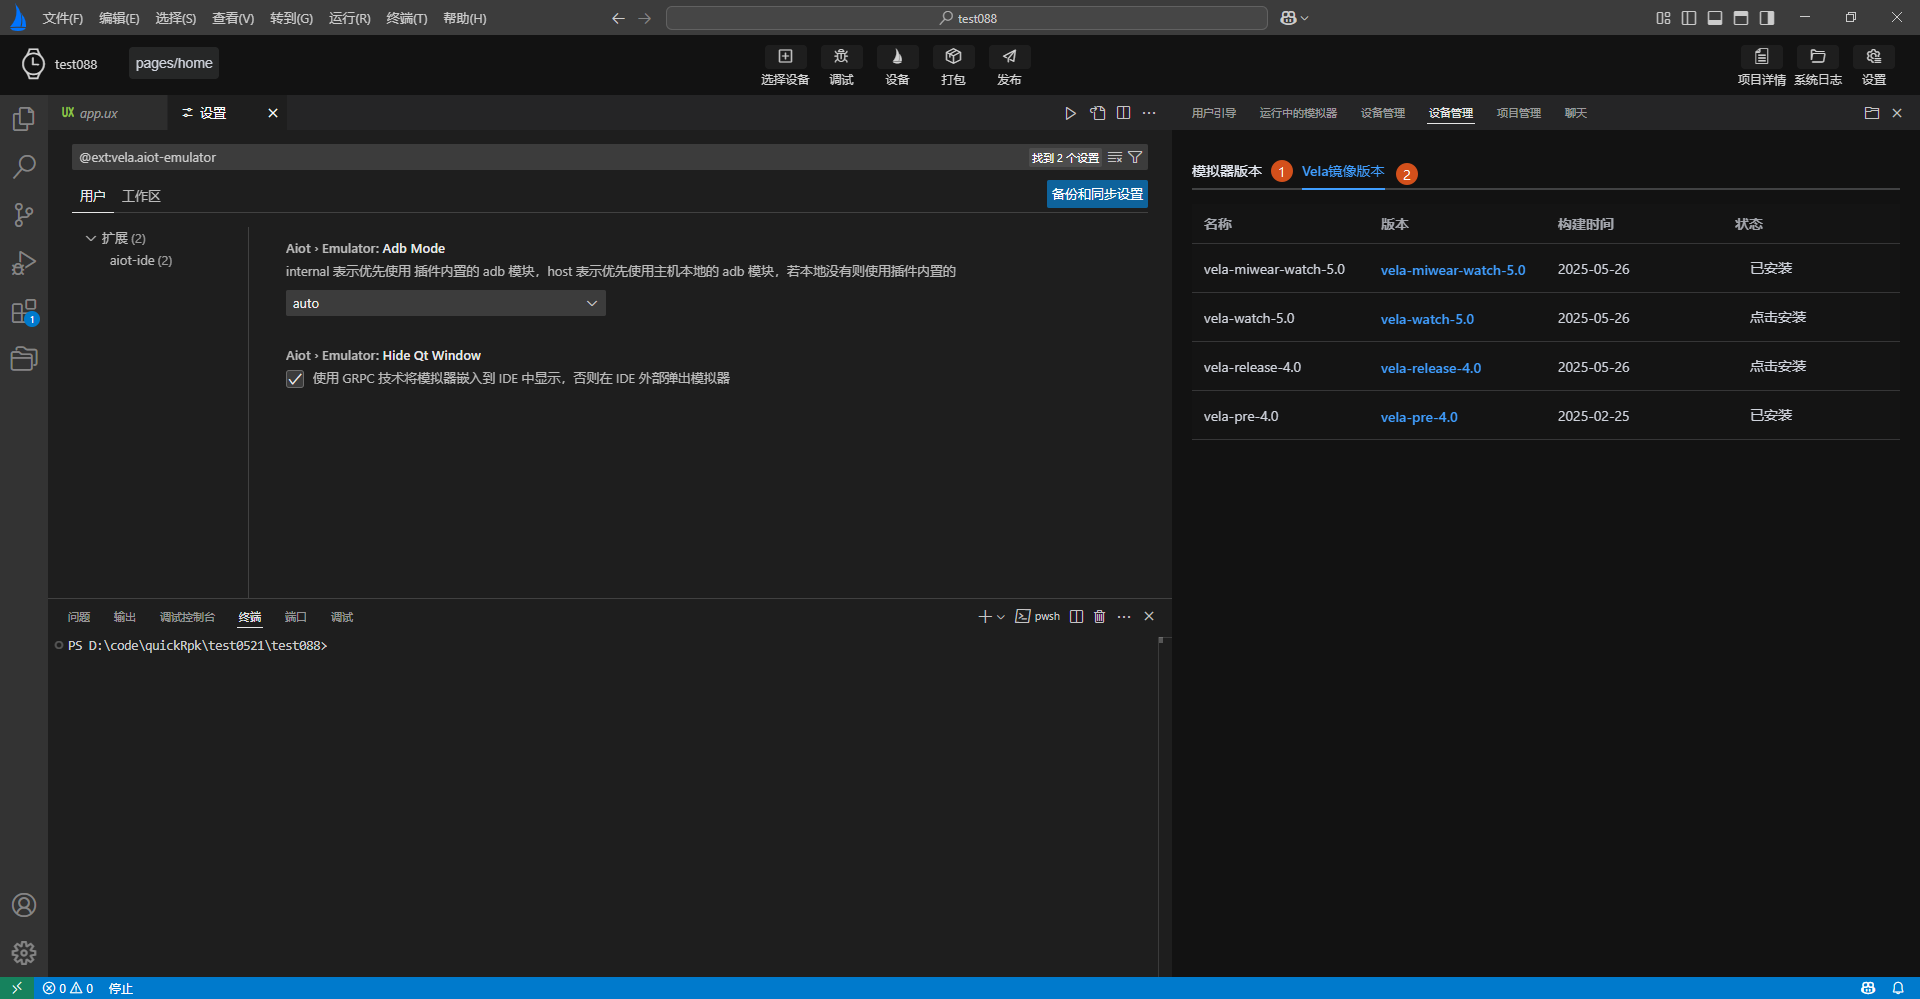
The device management page is mainly divided into two parts:
- 1. Simulator Management and Real Device Debugging: Provides functions for adding, deleting, modifying, and querying simulators, as well as running them and debugging on real devices.
- 2. Simulator SDK Management: Provides installation and updates for SDK packages required for the simulator runtime environment.
# Simulator Run Preview Page
The simulator preview page embeds the running simulator into AIoT-IDE for preview display. When the project dependencies and simulator environment are ready, follow these steps to preview the current project:
- Click the Select Device button in the top action bar to choose one or more simulators to run.
- Click the Debug button in the top action bar to run the simulator. The button will enter a loading state and turn blue after successful operation.
- The bottom toolbar starts outputting simulator runtime logs, and the page automatically switches from the user onboarding page to the simulator preview page.
- After the simulator runs successfully, the simulator preview page will display the corresponding simulator and push the currently opened Xiaomi Vela JS application to the running simulator.